


Investing - Oil and Gas 101
Recent posts about oil and gas brought some discussions between us on how to best assess and value an oil and gas exploration and production (“E&P”) company. We put together our general thoughts on E&P companies, why we think some metrics make sense, why others don’t, and some shortcomings of each. Here is our Oil and Gas 101.
E&P companies rarely generate positive free cash flows as the cash required to develop a resource play far outstrips the short-term cash flows received, especially if you are growing reserves and production quickly. The difficulty is figuring out which companies are profitably growing, versus simply just growing.
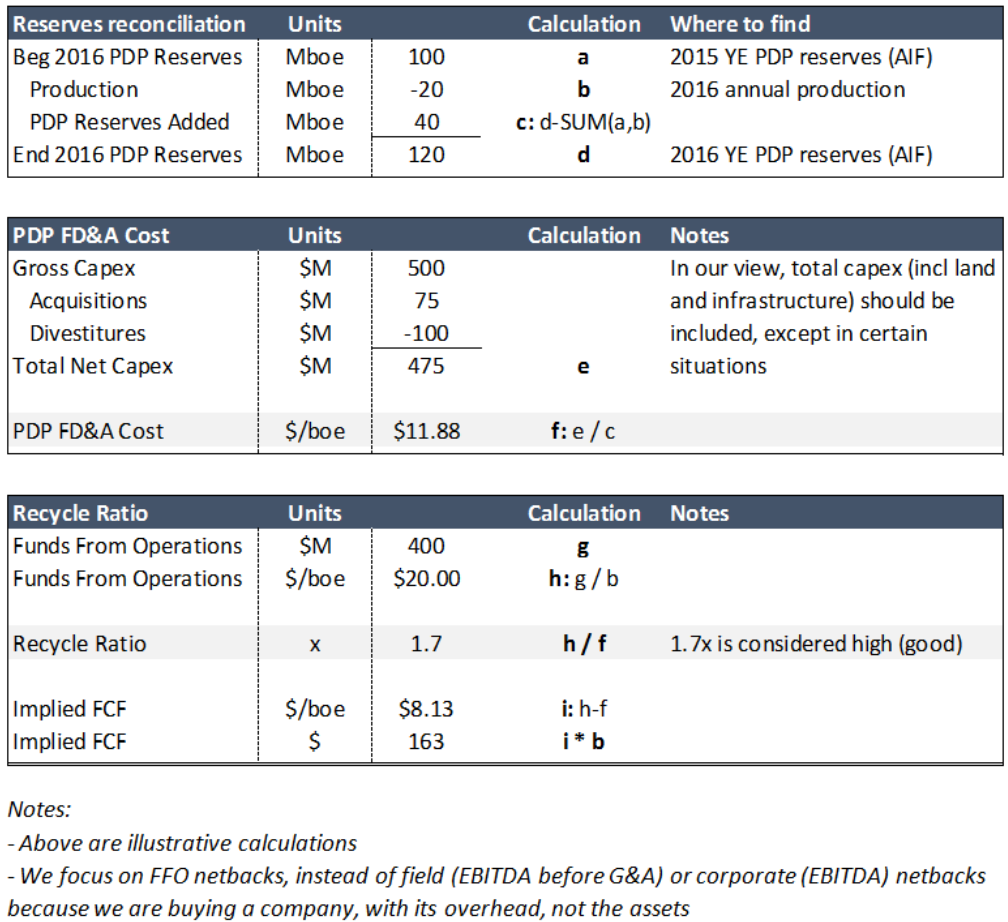
Like Moody’s, which in its ratings methodology places the highest rating weight on this metric, we believe the Recycle Ratio is the single most important metric in assessing E&P companies (notwithstanding the shortcomings, discussed later). There are many definitions of the Recycle Ratio, but in our view, the best definition is:
Recycle Ratio = [FFO per boe / PDP FD&A cost per boe]
NOTE: For definitions of terms (BOE, etc) we encourage you to check www.investopedia.com while Wikipedia has a decent background on types of reserves (like PDP being proved developed producing reserves) https://en.wikipedia.org/wiki/Oil_reserves
Netbacks and FD&A cost summary
We believe the best FD&A reserves to focus on are developed reserves (PDP and P+PDP in most cases). This means PD or P+PD, and PDP or P+PDP (PD vs PDP will depend on the situation – most of the time there is not much difference between them. Canadian company disclosures often do not allow you to calculate P+PDP, but all will allow you to calculate P+PD). The reason for this is that other types of reserves have a lot more room for leeway in recognition and other types of reserves still require additional capital to bring to production while PDP reserves do not (as all the capital has been spent).
We prefer to use 3-year FD&A costs: SUM(3-year net capex) / SUM(total reserves added) to smooth out yearly fluctuations. There are exceptions such as for abnormally long lead-time projects (ie, oil sands), or if a huge gas plant is being built, etc, where we will adjust either capex or reserves to fit a unique situation. Companies sometimes argue that infrastructure (gathering lines, small gas plants, etc) should not be included in FD&A costs. We disagree, as things like gathering lines are required to get products to market. It would be like a dairy farmer ignoring the cost of machines to put milk into containers. When was the last time you bought milk straight from the cow at your neighbourhood farm?
Sell-side analysts often give 1P or 2P FD&A costs. These 1P and 2P reserves include undeveloped reserves which require capital to develop and subsequently turn into cash flow-producing reserves. If the analyst report is worth more than the paper it is written on, they will include (changes in) Future Development Capital (“FDC”) in the FD&A cost. Even so, we do not like using 1P or 2P FD&A costs, because as discussed (i) a LOT of assumptions go into FDC, and (ii) there is no real way to test forecasted FDC vs actuals.
Recycle Ratio summary
We view the recycle ratio (the way we have defined) as a rough proxy for “sustaining” free cash flow. As in, if the company decided to keep production flat, what is its free cash flow? Some may be surprised at how low recycle ratios were even when WTI was at US$90-100/bbl. Although the illustrative calculations above do not show it, this way of calculating the Recycle Ratio is brutally unforgiving with a lot of companies generating ~<1.3x. But, it is a very good quantitative way to screen the efficient from inefficient operators. It’s not that a company is necessarily destroying value with a low ratio, but it is sure hard to make sure they aren’t.
Other ways to measure capital efficiency
The other common way to measure capital efficiency is to look at $/ boe/d.
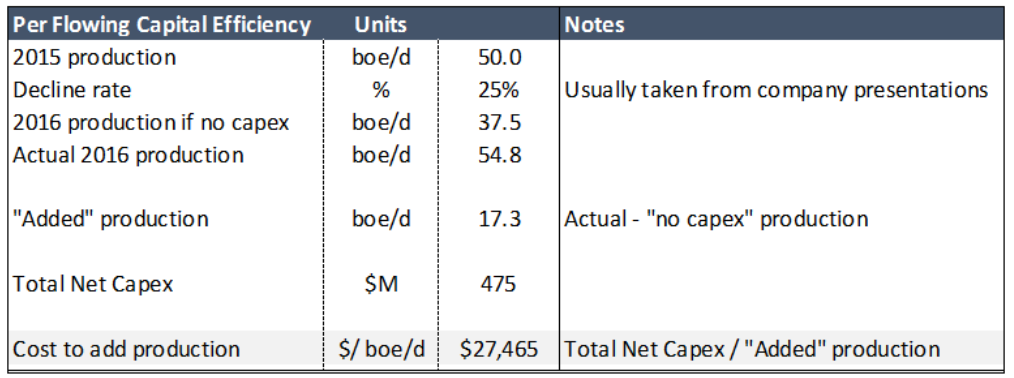
We prefer FD&A costs as opposed to this $/ boe/d metric because production levels can be managed, but developed reserves cannot (to an extent). Companies may sometimes purposely produce at below capacity in order to manage production levels. If there is unplanned downtime, they may just turn up wells that are producing at below capacity, in order to “smoothen” production levels. Companies sometimes also produce at below capacity because they may wait for higher oil/gas prices before turning up production levels. If a company went into the downturn producing at below capacity, and then slashed capex to nothing, they can still lessen the production decline by simply turning up the wells that were below capacity. There is nothing really wrong with this, but these issues make the $/ boe/d metric problematic. In turn, we prefer looking at developed reserves where you do not run into these types of issues.
Often, companies’ investor presentations show IRRs of their wells. Let us start by saying one individual from a well-respected E&P company’s M&A team said they generally cut these IRRs by 50% as a starting point. We generally find these IRRs problematic because (i) they are often on a well-only basis and do not include infrastructure capital costs which can be material, (ii) they may be IRRs of the best wells in an area and not the average ones, (iii) oddly enough, these “40%+ IRRs” somehow rarely ever translate into very high corporate returns on capital…
How do you value E&P companies? No really, how do you value them?
There are 3 ways we think make sense:
- Net Asset Value (“NAV”)
- Sustaining FCF Multiples
- Investor Recycle Ratio
NAV is basically a DCF of the reserves. Probable and other less-certain reserves are normally “risked”/aka discounted. Importantly, an analyst must make sure the E&P company can actually fund the FDC – if a company does not have any liquidity and little access to capital, undeveloped reserves cannot be developed. Although NAV is a fine way to value an E&P company, it does not take into account marginal returns on capital and whether a company is creating or destroying value via its capital program.
We believe Sustaining FCF is an acceptable way to value E&P companies, if (i) they have a very long runway of economic reserves (we would include SAGD companies in this), and (ii) you trust management will stick to their knitting. All you need to do is assume some commodity prices (ie, your FFO), slap a multiple on your Sustaining FCF, and you’re good to go! The problem with Sustaining FCF is that, if a company is producing nil FCF (either due to low commodity prices, or has an earlier stage program that is higher cost, etc) this implies the company is worthless, which is clearly not true since the existing reserves are clearly worth something if they just run down reserves (ie, a NAV on developed producing reserves).
Investor Recycle Ratio is stolen from an old Peyto monthly management letter. It is calculated as: [ EBIT Netback / (EV / Reserves) ]. The rationale for this is, if you bought the entire company for its EV, you would now own all of its reserves. Effectively, this is your own F&D cost (the denominator of the formula). You would then receive all the company’s CFs (the numerator), so you can effectively calculate your own recycle ratio. What is a “good” Investor Recycle Ratio? Hard to say. Comparing with actual E&P companies’ recycle ratios, we think it should be over 1.5x to be attractive. The Investor Recycle Ratio is a good way to do a relative valuation though.
Which is the best? We think it depends on the situation. If a company is unprofitable (as measured by the Recycle Ratio) and is not actively developing new reserves, we think a NAV is best for cigar-butt-type investments. Otherwise, we prefer either the Investor Recycle Ratio, or Sustaining FCF.
Shortcomings of the above-mentioned metrics
FD&A Costs and $/ boe/d capital efficiency metrics: A boe is usually not the same as another boe, as it does not take into account netback margins. All things being equal, if Company A’s FD&A cost is $15/boe and those reserves will generate $30/boe netbacks, this is better than Company B’s FD&A cost of $10/boe which will generate $15/boe netbacks. An analyst must at the very least look at the products (oil, NGLs or natural gas) that the company is finding, as this should give a sense of future netbacks.
Recycle Ratio: The numerator (FFO) is mostly generated by old/existing reserves, while the denominator (FD&A) is based on new reserves being added. Further to the shortcomings of FD&A costs, if a company with existing high-netback production and reserves starts finding low-cost/boe reserves but which are low netback, the Recycle Ratio will be artificially high in the short-term and will actually decline over time as the new low-netback reserves start to take up a larger portion of production.
Companies typically brag about 20-year drilling inventories, but there is a lot of judgement that goes into that estimate, and since there is a natural tendency for management teams to drill the best reserves first, we think you really have to take a “leap of faith” on these claims. Therefore, we believe an analyst must really trust that management will not chase “hot” plays or drill higher-cost reserves if they run out of economic and predictable reserves. If a management team has allowed their production to decline when capital or operating costs increase too much (particularly when the rest of the industry is increasing production), we think this is a good indicator of discipline. Peyto is a good example of a company scaling capex back during the mid-late 2000s when capital cost inflation was very high. Admittedly, this is difficult, and forces an analyst to have a very short list of companies worth investing in.
A further note on developed reserves. We recognize that the only way to acquire a very long runway of drilling inventory is to usually buy undeveloped land which do not normally have producing wells (ie, land bank). Using an FD&A cost on developed reserves becomes meaningless. Appreciating this chicken and egg situation, we generally think that unless an analyst has some special insight into the management team's track record and the undeveloped asset base, it is safest to simply watch from the sidelines.
Credit analysis for E&P companies
Typically, companies under ~<30,000 boe/d are on reserve-based or borrowing-based credit facilities. This means that at least once a year (usually twice, and occasionally more if there are material acquisitions/divestitures), the credit facility size is re-calculated based on reserves and commodity prices. Generally, the credit facility size is ~60-70% of PD NAV at something close to the forward curve.
From an equity investor’s perspective, this can be problematic. If a company has a $100 facility with $80 drawn, and the borrowing base value is re-determined at $60, the company could be given only a couple months to repay the $20 ($80 - $60). Enter dilutive equity raises, high-cost debt issuances, and/or forced asset sales. The best way to avoid this situation as an investor is to look for companies with high Recycle Ratios, as these companies’ borrowing base values will usually be less impacted by changes in commodity prices.
Some other useful metrics to look at, in addition to the typical leverage and liquidity metrics, are:
- Total Possible Debt/ PDP Reserves
- Total Possible Debt/ Production
Where Total Possible Debt = Debt + Revolver Availability.
If a company’s FFO netback is high relative to its Debt/ PDP Reserves (ie, an acquiring company would earn a decent Recycle Ratio say of >1x if it bought the company for its debt), this should imply a lower probability of debt impairment.
Regarding asset retirement or decommissioning obligations, Moody’s does not include this in Debt, while S&P does, so there is even disagreement among the rating agencies. We definitely take note of these obligations but usually do not include them in leverage calculations although there are sometimes good reasons to – we’ll save discussions on these considerations for another day.
Summary
If you had to boil down analysis to a single metric, the Recycle Ratio as we have defined is the best one. After this, an analyst should then analyze incremental returns on capital, as measured by FD&A costs relative to the netbacks of the new reserves’ products. The Investor Recycle Ratio or Sustaining FCF is a good way to value a company; but of course an analyst must then hope and pray their commodity price assumption turns out to be right!